The leaflet is a popular open-source JavaScript library used for creating interactive maps on websites. It is widely used in GIS applications and data visualization projects. The library is lightweight and easy to use, making it a popular choice for developers and data scientists alike.
Advantages of Leaflet
- Lightweight and Fast Leaflet is designed to be fast and efficient, making it ideal for creating maps for websites and mobile devices. It has a small codebase, which means that it takes up less space and loads quickly. This makes it a popular choice for creating maps for web applications and mobile devices.
- Easy to Use Leaflet is easy to use and requires no previous programming experience. It has a simple API, and the documentation is comprehensive and well-organized, making it easy for developers to get started.
- Customizable Leaflet provides a wide range of customization options, allowing developers to create unique and highly interactive maps. It supports the use of different map tiles, markers, popups, and layers, which can be combined in different ways to create unique and compelling maps.
- Open-Source Leaflet is an open-source library, which means that it is free to use and can be easily customized and extended. This makes it an ideal choice for developers who want to create custom GIS solutions without the need for expensive commercial software.
Getting Started with Leaflet
- Setting up a Leaflet Map To create a Leaflet map, you need to include the Leaflet JavaScript library in your HTML file. You can either link to the library hosted on a CDN or download it to your local machine.
- Adding a Base Map Once you have set up the Leaflet library, you can add a base map to your map. A base map is a map that provides a background for your data layers. Leaflet supports a wide range of base maps, including OpenStreetMap, Mapbox, and Bing Maps.
- Adding Markers Markers are used to identify specific locations on a map. Leaflet provides a simple way to add markers to your map. You can specify the location of the marker using latitude and longitude coordinates, and you can also customize the appearance of the marker by changing its icon and color.
- Adding Popups Popups are used to provide additional information about a location when a user clicks on a marker. Leaflet provides a simple way to add popups to your markers. You can specify the content of the popup using HTML, and you can also customize its appearance by changing its style.
- Adding Layers Layers are used to display different types of data on a map. Leaflet provides a simple way to add layers to your map. You can add different types of data, such as GeoJSON data, WMS data, and KML data, as layers on your map.
- Interacting with the Map Leaflet provides a range of options for interacting with your map. You can pan and zoom the map, and you can also add controls, such as zoom controls, layer controls, and scale controls, to your map.
Leaflet Plugins and Extensions
Leaflet plugins and extensions are additional tools that can be used to enhance the functionality of Leaflet maps. These tools are created by third-party developers and are often open-source, making them easily accessible and customizable. Some of the most popular Leaflet plugins and extensions include:
- Leaflet Draw: A plugin that allows users to draw shapes and lines on the map. This can be useful for annotating maps or creating custom geographic data.
- Leaflet MarkerCluster: A plugin that groups markers together when they are close to each other on the map. This can help to reduce clutter and improve map readability.
- Leaflet Heatmap: A plugin that displays heat maps on the map, with areas of higher intensity being represented by warmer colors. This is useful for visualizing data such as crime rates, population densities, and traffic patterns.
- Leaflet Routing Machine: A plugin that provides routing and navigation functionality for Leaflet maps. This can be useful for creating custom maps with turn-by-turn directions or for displaying routes on a map.
- Leaflet Search Control: A plugin that adds a search box to the map, allowing users to search for locations by name or address. This is useful for improving the usability of maps and making it easier for users to find specific locations.
- Leaflet TimeDimension: A plugin that allows users to display time-based data on the map. This can be useful for visualizing data such as weather patterns, air quality, and traffic conditions.
The steps for creating a basic Leaflet map
- Import the Leaflet Library: The first step in creating a Leaflet map is to import the Leaflet library into your HTML file. You can either include the library from a CDN or download it to your local machine and include it from there.
- Create a Map Container: Next, create an HTML element that will act as the container for your map. This can be a div element with a unique ID that you can reference when initializing the map.
- Initialize the Map: Use the L.map() function to initialize the map and specify the ID of the HTML element that will serve as the container. Set the initial center and zoom level for the map.
- Add a Tile Layer: Leaflet maps are created using tile layers, which are images that are cut into small squares and displayed on the map. Use the L.tileLayer() function to add a tile layer to your map, specifying the URL of the tile layer you want to use.
- Add Markers: Use the L.marker() function to add markers to your map, specifying the coordinates of the markers. Markers can be customized with icons, popups, and other features.
- Add Popups: Popups can be added to markers to provide additional information about a location. Use the bindPopup() method to add a popup to a marker, specifying the HTML content of the popup.
- Add a Legend: If necessary, add a legend to your map to explain the meaning of different features on the map. Use the L.control.layers() function to add a layer control, which can be used to switch between different layers on the map.
- Finalize the Map: Finally, use the fitBounds() method to adjust the zoom level and center of the map so that all markers are visible.
Example Code:
by GISvacancy.com
<html>
  <head>
    <link rel="stylesheet" href="https://unpkg.com/[email protected]/dist/leaflet.css" />
    <script src="https://unpkg.com/[email protected]/dist/leaflet.js"></script>
  </head>
  <body>
    <div id="map" style="height: 500px; width: 100%;"></div>
    <script>
      // Initialize the map
      var map = L.map('map').setView([28.705, 77.1025], 13);

      // Add a tile layer
      L.tileLayer('https://{s}.tile.openstreetmap.org/{z}/{x}/{y}.png', {
        attribution: 'Map data © <a href="https://openstreetmap.org">OpenStreetMap</a> contributors'
      }).addTo(map);

      // Add a marker
      L.marker([28.705, 77.1025]).addTo(map)
        .bindPopup("<b>Hello world!</b><br />I am a popup.").openPopup();

    </script>
  </body>
</html>
This is the basic code for creating a Leaflet map, with a tile layer and a single marker. You can add additional features and customize the map as needed.
Conclusion
The leaflet is a popular and widely-used open-source library for creating interactive maps. It is lightweight, fast, and easy to use, making it a popular choice for GIS applications and data visualization projects. Leaflet plugins and extensions provide additional functionality, making it possible to create custom maps with a wide range of features and capabilities. Whether you are a developer, data scientist, or simply interested in creating maps, Leaflet is a powerful and versatile tool that can help you achieve your goals.
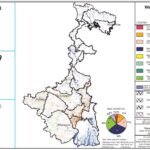
- West Bengal Map

- Geospatial Intelligence and Machine Learning Applications in the Air Force: An In-Depth Analysis
- Honorary Doctorate – ‘Dr’
- Remote Sensing of Environment
- Geospatial Bill of India 2022